| Type of paper: | Essay |
| Categories: | Management Marketing Business Analysis |
| Pages: | 18 |
| Wordcount: | 4805 words |
6. Results
6.1. Descriptive Statistics Analysis
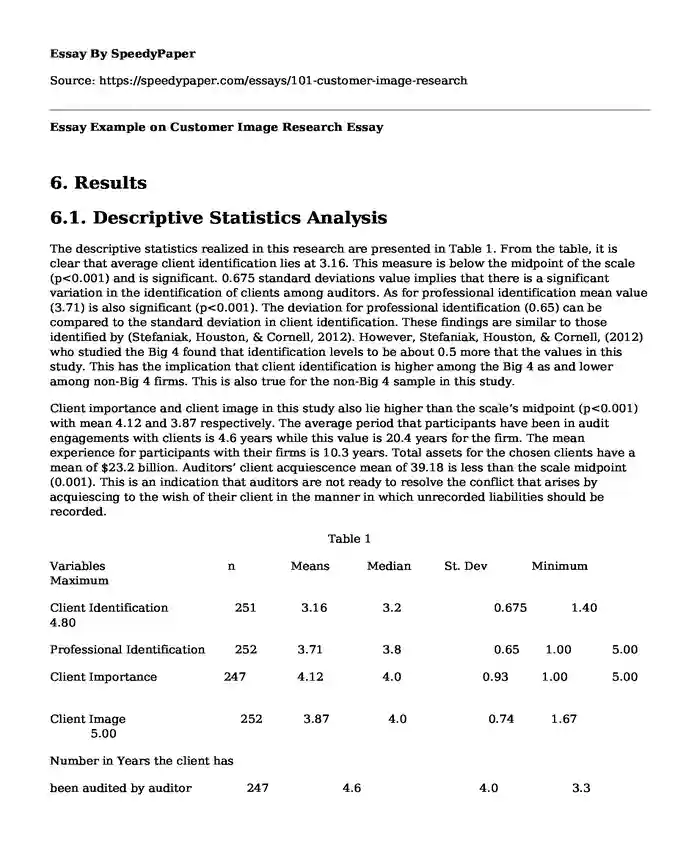
The descriptive statistics realized in this research are presented in Table 1. From the table, it is clear that average client identification lies at 3.16. This measure is below the midpoint of the scale (p<0.001) and is significant. 0.675 standard deviations value implies that there is a significant variation in the identification of clients among auditors. As for professional identification mean value (3.71) is also significant (p<0.001). The deviation for professional identification (0.65) can be compared to the standard deviation in client identification. These findings are similar to those identified by (Stefaniak, Houston, & Cornell, 2012). However, Stefaniak, Houston, & Cornell, (2012) who studied the Big 4 found that identification levels to be about 0.5 more that the values in this study. This has the implication that client identification is higher among the Big 4 as and lower among non-Big 4 firms. This is also true for the non-Big 4 sample in this study.

Client importance and client image in this study also lie higher than the scale’s midpoint (p<0.001) with mean 4.12 and 3.87 respectively. The average period that participants have been in audit engagements with clients is 4.6 years while this value is 20.4 years for the firm. The mean experience for participants with their firms is 10.3 years. Total assets for the chosen clients have a mean of $23.2 billion. Auditors’ client acquiescence mean of 39.18 is less than the scale midpoint (0.001). This is an indication that auditors are not ready to resolve the conflict that arises by acquiescing to the wish of their client in the manner in which unrecorded liabilities should be recorded.
Table 1
Variables n Means Median St. Dev Minimum Maximum
Client Identification 251 3.16 3.2 0.675 1.40 4.80
Professional Identification 252 3.71 3.8 0.65 1.00 5.00
Client Importance 247 4.12 4.0 0.93 1.00 5.00
Client Image 252 3.87 4.0 0.74 1.67 5.00
Number in Years the client has
been audited by auditor 247 4.6 4.0 3.3 1
The Years the client has been
audited by the firm 246 20.4 15 20.5 1 100
Auditor Experience with
the Firm (Years) 252 10.25 6.585 8.67 1.5 38
Client Size (total assets in
billions $) 233 23,249 1,500 91,442 1 802,000
Auditor’s Client
Acquiescence 247 39.18 35 26.6 0 100
The coefficients for Pearson correlations for the variables are displayed in Table 2. When these correlations were analyzed, it was evident that there are potential significant relationships between the key variables. There are significant correlations for the acquiescence of the client, actual years that a participant had been auditing the client, auditor’s experience and how auditors identify with their profession when the significance level is (p) is 0.05 or less. Similarly, the correlation between client identification with images of clients and importance, the years that the client has been audited by the participant and auditors’ identification with professions is significant at (p<0.01). It is the same for client image and client importance with the size of the client at p<0.05. Nevertheless, it must be noted that the correlations are not large enough to make a suggestion that the variables used in this study point to a similar underlying construct.
6.2. Measurement Models Analysis
Here, the first thing was to perform an analysis of factors for the study’s latent variables namely clients identifications, client image, and professional identifications. The reason it was done is to verify factor structures for the items which helped to find out if the elements in the scale used are in line with a similar latent factor. As the basis of deleting one item from the scale of client identification, loadings and results of modification indices were used.. (Anderson, & Gerbing, 1988) proposed that an item that does not fit well with the latent factor should be deleted.
Table 2
Client Professional Auditor Client Client Firm Auditor Client
Identification Identification Tenure Imporance Image Tenure Experience Size
Client Acquiescence .044 -.137* -.128* .024 .024 -.034 -288** .075
Identification of clients -.201** .180** .242** .242** .089 -.024 .010
25
Identification with profession .074 .106 .161* -.054 .223** .-.120
Auditor Tenure .068 .066 .167** .416** .026
Client’s Importance .331** .215** -050 .168*
Client’s Image .134* .085 .133*
Firm’s Tenure .026 .031
Experience of auditor -.004
Table 3
Outcomes of Confirmatory Factor Analysis
Measure of Fit
X2 262.65 (p<0.01)
df 101
RMSEA 0.07
CFI 0.92
IFI 0.92
GFI 0.90
AGFI 0.84
Standardized Root Mean Square Residual (RMR) 0.05
The outcome of the analysis indicates that there is no difference between the patterns studied in the data and the measurement model analysis. With this case the null hypothesis will not be rejected that this is a good fit. Taking the chi square value above therefore qualify the measurement analysis model to be acceptable. The RMSEA( Root Mean Square Error of Approximation) for this analysis is 0.07. The value of 0.07 is less than 1 therefore make it possible for the measurement analysis model is acceptable. From the analysis above the estimate RMSEA is 0.07, 92% confidence.
Confirmatory factor analysis results are displayed in Table 3. As for the RMSEA, values of up to 0.08 show reasonable approximation errors (Rigdon, 1996). CFI, IFI, GFI and the AGFI are also used in the evaluation of fit resulting measurement models. These measures can assume any value between 0 and 1.0. A good fit is indicated by values which are greater than 0.90 (Hair, Anderson, Tatham and Black (1998). Smaller standardized RMR values (0.05 or less) indicate good model fit. The fit of the measurement model is acceptable when all indices are considered except for the case of AGFI. Evaluation of validity and reliability of index items revealed that constructs are related to items in all cases (p<0.01). According to guidelines by Hair, Anderson, Tatham and Black (1998), items that are representative of the latent construct lead to high variance extracted values (more than 0.50). All three constructs’ measures exceed the threshold as is evident in Table 3. Also, composite reliabilities are more than the recommended level (0.70).
Construct Composite Reliability Variances Extracted
Identification with profession 0.85 0.54
Client Identification 0.81 0.52
Image of the client 0.85 0.67
Items Standardized Loadings
Professional Identification
Criticism about my profession is like a personal insult 0.57
I say “We” instead of “They” when talking about my client 0.62
What other people think about my profession is of much interest to me 0.71
The successes of my profession are also my successes 0.77
Praising my profession is like a compliment to me 0.94
Identification with Clients
I take praising of this client as a personal compliment 0.65
I say “We” instead of “They” when talking about this client 0.57
The successes of this client are also my successes. 0.71
I take criticizing this client as a personal insult 0.88
Client Image
The reputation of this client in the business community is bad 0.68
The public regards this client highly. 1.00
This client is among the best to work with 0.73
The next thing was to perform a principal component analysis to see if the constructs are distinct. The analysis was subjected to items making up the three constructs: client identification, client image, and their professional identification. All client identification scale items except one (loading 0.43) loaded more than 0.50 on the intended factor. Cross-loadings of up to 0.30 were not realized. From these findings, it is clear that these measures are assessing three different constructs. From the factor loadings, validity and reliability and the confirmatory factor analysis results, it would be sensible to conclude that the measurement model is acceptable.
The original 9-factor model was trimmed into a 6-factor model to test if common method bias interfered with the inferences. The two models were compared, and this revealed that the data was well-fit of the original 9-factor model (X2 =262.65, df=101) for this study than the 6-factor model (with chi-square value of 1058.68 and df =125).
Therefore, a bias of common method problem is insignificant in this study. Next, Rigdon’s (1996) suggestion was used in the estimation of the two models (measurement and structural
Cite this page
Essay Example on Customer Image Research. (2018, Mar 10). Retrieved from https://speedypaper.net/essays/101-customer-image-research
Request Removal
If you are the original author of this essay and no longer wish to have it published on the SpeedyPaper website, please click below to request its removal:
- Essay Example on Wildlife Poaching
- Free Essay: Porsche Case Study Analysis
- Philosophy Essay Sample on the Ontological Argument: Objective and Subjective Reflection
- Free Essay on Negotiation Experiences
- Genocide in the 20th Century, Essay Sample in History
- Is there pressure on teenagers to go to college?
- Essay Sample on Ventilator-Associated Pneumonia Prevention
Popular categories


