| Type of paper: | Essay |
| Categories: | Company Finance Business |
| Pages: | 7 |
| Wordcount: | 1805 words |
Howard Hughes real estate
Howard Hughes Corporation (HHC) is a real estate development and Management Company operating in Houston, Las Vegas and Maryland. Since its inception in 1913, it has posted a solid track record with significant improvements in its operating income. It mainly focuses on establishing business parks as well as shopping centers in Las Vegas. It also owns some malls and numerous residential homes with mixed-use buildings. It is also the owner of New York City South Street Seaport. Ideally, the company which is now the second largest mall operator in the country was on the verge of collapse in 2009 when it faced a distress in it credit market conditions.

Real estate is a highly class business-cycle sensitive asset class dynamic especially the constantly changing real estate prices. However, Howard Hughes has come out strongly as a trustable company which has worn the hearts of many investors especially from its strong developed a strong real estate portfolio and gained public trust.
The company develops, operates and sells properties in master planned communities. Through the sales it makes, it is able to generate massive revenue. Ideally, it has four key master planned communities in Houston, Las Vegas and Maryland in addition to the business segments it holds including operating assets (retail properties) as well as the real estate development portfolio.
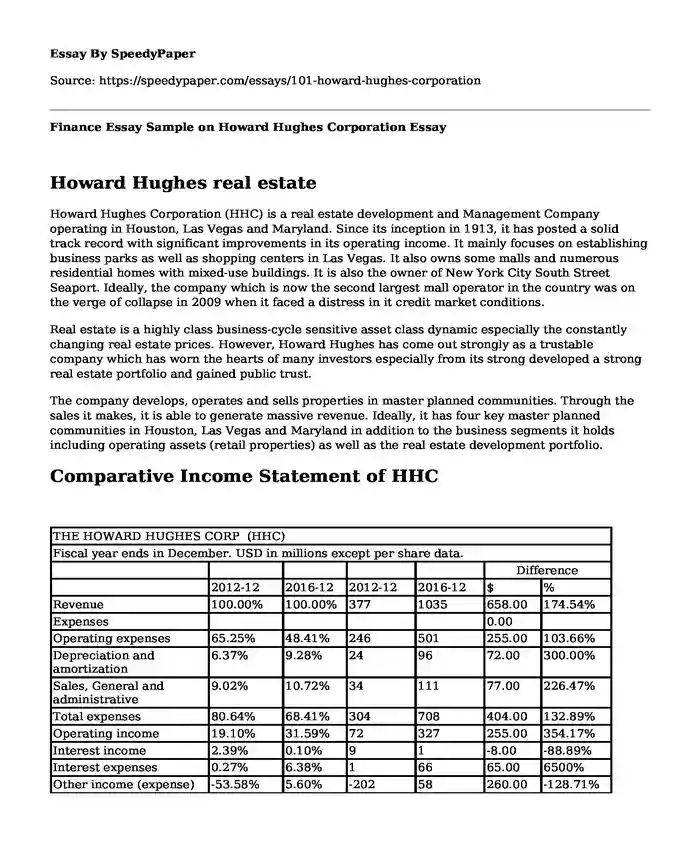
Comparative Income Statement of HHC
| THE HOWARD HUGHES CORP (HHC) | ||||||
| Fiscal year ends in December. USD in millions except per share data. | ||||||
| Difference | ||||||
| 2012-12 | 2016-12 | 2012-12 | 2016-12 | $ | % | |
| Revenue | 100.00% | 100.00% | 377 | 1035 | 658.00 | 174.54% |
| Expenses | 0.00 | |||||
| Operating expenses | 65.25% | 48.41% | 246 | 501 | 255.00 | 103.66% |
| Depreciation and amortization | 6.37% | 9.28% | 24 | 96 | 72.00 | 300.00% |
| Sales, General and administrative | 9.02% | 10.72% | 34 | 111 | 77.00 | 226.47% |
| Total expenses | 80.64% | 68.41% | 304 | 708 | 404.00 | 132.89% |
| Operating income | 19.10% | 31.59% | 72 | 327 | 255.00 | 354.17% |
| Interest income | 2.39% | 0.10% | 9 | 1 | -8.00 | -88.89% |
| Interest expenses | 0.27% | 6.38% | 1 | 66 | 65.00 | 6500% |
| Other income (expense) | -53.58% | 5.60% | -202 | 58 | 260.00 | -128.71% |
| Income before income taxes | -32.10% | 31.01% | -121 | 321 | 442.00 | -365.29% |
| Provision for income taxes | 1.86% | 11.40% | 7 | 118 | 111.00 | 1585.71% |
| Net income from continuing operations | -33.95% | 19.52% | -128 | 202 | 330.00 | -257.81% |
| Other | -0.27% | 0.00% | -1 | 0 | 1.00 | -100.00% |
| Net income | -33.95% | 19.52% | -128 | 202 | 330.00 | -257.81% |
| Net income available to common shareholders | -33.95% | 19.52% | -128 | 202 | 330.00 | -257.81% |
| Earnings per share | ||||||
| Basic | -3.36 | 5.12 | -3.36 | 5.12 | 8.48 | -252.38% |
| Diluted | -3.36 | 4.73 | -3.36 | 4.73 | 8.09 | -240.77% |
| Weighted average shares outstanding | ||||||
| Basic | 38 | 39 | 38 | 39 | 1.00 | 2.63% |
| Diluted | 38 | 43 | 38 | 43 | 5.00 | 13.16% |
| EBITDA | -25.20% | 46.57% | -95 | 482 | 577.00 | -607.37% |
Incomes
Comparing the year 2012 and 2016, it can be seen that there has been has generally been an increase in the revenue amount by 174.54% postulating an upward trend which consequently implies that Howard has been profitable from its operations. The revenue in 2012 was $377 while in 2016 it was $1035. This shows that the incomes increased by $658 representing an increase by 174.5% increase in revenues. With regards to the net incomes from operations, Howard Inc. increased in its profit level from a loss of $-128 to a profit of $202 in 2016 which represents an increase of 257.81%. The profitability ratios are as follows:
| 2012 | 2016 | |
| Profitability Margin | -- (33.95)% | 19.52% |
The increase in profitability from (33.95%) to 19.52% shows that the company increased in profitability over the years.
Expenses
Taking a look at the expenses, there has also been an upward increase in the expenses and this may be due to the expenses incurred in acquiring properties as well as general and administrative expenses. The amount of total expenses in 2012 was $304 while in 2016 it was 708 representing an increase by 132.9%. A huge proportion of the expenses were as a result of operating expenses.
Basic Earnings per share of HHC
The basic earnings per share has continuously increased from the years 2012 to 2016 and due to this, investors are very much interested in investing in the organization. The basic earnings per share increased from -3.36 to 5.12 which implies that the investment of shareholders in Howard gained value in 2016 than in 2012.
Comparative Balance sheet Statement
| THE HOWARD HUGHES CORP (HHC) | ||||||
| Fiscal year ends in December. USD in millions except per share data. | ||||||
| % | $ | |||||
| 2012-12 | 2016-12 | 2012-12 | 2016-12 | Difference | ||
| Assets | $ | % | ||||
| Real estate properties | 70.60% | 78.22% | 2473 | 4980 | 2507 | 101.37% |
| Accumulated depreciation | -3.20% | -3.86% | -112 | -246 | -134 | 119.64% |
| Real estate properties, net | 67.37% | 74.35% | 2360 | 4734 | 2374 | 100.59% |
| Cash and cash equivalents | 6.54% | 10.46% | 229 | 666 | 437 | 190.83% |
| Receivables | 12.87% | 2.51% | 451 | 160 | -291 | -64.52% |
| Other assets | 13.19% | 12.67% | 462 | 807 | 345 | 74.68% |
| Total assets | 100.00% | 100.00% | 3503 | 6367 | 2864 | 81.76% |
| Liabilities and stockholders' equity | ||||||
| Liabilities | ||||||
| Long-term debt | 19.64% | 42.26% | 688 | 2691 | 2003 | 291.13% |
| Payables and accrued expenses | 4.88% | 7.65% | 171 | 487 | 316 | 184.80% |
| Other liabilities | 9.68% | 9.77% | 339 | 622 | 283 | 83.48% |
| Total liabilities | 34.20% | 59.68% | 1198 | 3800 | 2602 | 217.20% |
| Stockholders' equity | ||||||
| Common stock | 0.00% | 0.00% | 0 | 0 | ||
| Additional paid-in capital | 80.62% | 44.81% | 2824 | 2853 | 29 | 1.03% |
| Retained earnings | -14.56% | -4.37% | -510 | -278 | 232 | -45.49% |
| Treasury stock | 0.00% | -0.02% | -1 | -1 | 0 | |
| Accumulated other comprehensive income | -0.29% | -0.11% | -10 | -7 | 3 | -30.00% |
| Total stockholders' equity | 65.80% | 40.33% | 2305 | 2568 | 263 | 11.41% |
| Total liabilities and stockholders' equity | 100.00% | 100.00% | 3503 | 6367 | 2864 | 81.76% |
Comparative analysis of Howard Balances sheet between the years 2012 and 2016
Howard has continuously increased its capital base in terms of the assets it has continued to purchase. Taking a comparison between the year 2012 and 2016, Howard has increased its real assets base by 8% and its total assets base by USD $2730. This can be attributed to the fact that Howard acquired new properties.
In 2012, the long term debt stood at $688 and in 2016, Howard had increased its long term debt by $2003. This was the same case with trade payables as well as other liabilities which increased by $316 and $283 respectively each implying that there was increase in the debt level by 22.62%, 2.77% and 0.09% respectively. The implication of this is that Howard borrowed more money from external financial organizations most of which were debts payable over long period of time. The retained earnings however increased by $232 representing a 10.19% change. However, the retained earnings were negative implying that I overdrew the retained earnings probably to invest in other ventures, pay shareholders or reduce its debt.
| current ratio | ||
| 2012 | 2016 | |
| Total current assets | 1142 | 1633 |
| Total current liabilities | 1198 | 3800 |
| Current ratio | 0.95326 | 0.42974 |
The current ratio decreased by 0.52 showing that company financed its liabilities less in 2016 than in 2012.
Debt ratio
| debt ratio | 2012 | 2016 |
| Total debt | 1198 | 3800 |
| Total assets | 3503 | 6367 |
| Debt ratio | 0.34199 | 0.59683 |
The company increased in the debt ratio shows that it increased in the amount of debt. The debt ratio increased by 0.25 implying that the company took more debt in 2016 than in 2012.
Cashflow Statements
Preparation of the cashflows using Indirect Method
| Cash Flows From Operating Activities | |
| Net income | 202 |
| Adjustments: | |
| Depreciation & amortization | 72 |
| Interest loss | 8 |
| Deferred income taxes | 111 |
| Interest Expenses | 65 |
| Decrease in accounts receivables | 291 |
| Increase in other current assets | (345) |
| Increase in payables | 316 |
| Net cash generated from operating activities | 518 |
| Cashflow before Investing activities | 720 |
| CASH FLOWS FROM INVESTING ACTIVITIES | |
| Acquisitions real estate, net | (2374) |
| Investment in properties and investments | (144) |
| Net cash used for investing activities | (2,518) |
| Cashflow before financing activities | (1,798) |
| CASH FLOWS FROM FINANCING ACTIVITIES | |
| Increase in additional paid-in-capital | 29 |
| Increase in long-term debt | 2003 |
| Increase in other Liabilities | 283 |
| Net cash provided by from financing activities | 2,315 |
| Net change in cash | 517 |
| Cash at beginning of period | 229 |
| Cash at end of period | 746 |
The cashflow from operating activities was $518. The non-cash adjustments including depreciation and amortization plus the interest and tax expenses were added to the net income inorder to obtain the cashflows from operating activities. Comparing the accounts receivables of Howard Company in the years 2012 and 2016, it can be seen that Howard’s account receivables decreased while the balance of other current assets increased. This was the same case with the accounts payables. The decrease in accounts receivables and the increase in accounts payables was added to the cashflows since this represented an increase in the cashflows amount of the company.
The cashflows from investing activities totaled to (2,518). This figure was contributed greatly the acquisition of real estate properties as well as investments.
The cashflows from financing activities was 2,315. In this case, the additional paid-in-capital, acquisition of long-term debt as well as other liabilities were added up to the cashflows from investing activities to obtain a net cashflows of $517. Adding the cashflows to the opening cash and cash equivalent, the cash at the end of period which represents the closing balance of $746 is obtained.
Income Statement Ratios
Net Profit Margin
Net profit margin = Net income
Sales/Revenue
The net profit margin of HHC
The net profit margin is also known as the return on sales. It indicates how much of each dollar of sales is left over after all expenses.
| Year | 2012 | 2016 |
| Net profit margin | -128/ 377 = - 0.34 | 202/1035 = 0.20 |
Explanation
The net profit margin has continuously increased form the year 2012 (-0.34) to 2016 (0.20). The upward trend in the net profit margin shows that Howard had more net profit left after all expenses had been paid in 2016 than in all other years.
Balance Sheet Ratios
Debt ratio = Total Debt/Total asset
| Year | 2012 | 2016 |
| Debt Ratio | 1198/3503 = 0.34 | 3800/6367 = 0.60 |
What does the debt to equity ratio tell us
The debt ratio indicates the proportion of assets that are financed with debt. It measures the extent to which borrowed funds have been used to finance the firm's operations.
Explanation
From the debt ratio, it is clear that Howard has continuously increased its borrowing since the debt ratio has been continuously increased from 0.34 to 0.60 in 2016. It also indicates that most of the finances of the company has been outsourced using borrowed funds thus the reason for a higher proportion of debt financed by assets in 2016.
Conclusion
Howard Hughes has a promising future especially because it has continuously showed positive progress, growth as well as profitability. The revenues it has posted over the previous years has shown that it has been operating favorably and this has indeed attracted other investors to join the company.
Recommendation
As Howard continues to look for means of financing its operations, it would be recommendable to reduce the proportion of its debt as well as the operational and miscellaneous expenditures that it incurs. It should focus more on financing its activities through its own funds.
One way it could do this is by ploughing back its profits and to achieve this, it should reduce the dividend payout amount and increase its investments through ploughed back profits. Howard should thus check its expenses and cost level and ensures that it regulates the expenditures in a prudent way. Also, Howard can also consider making additional investment which bring about an increase in the investment level.
References
Arkan, T., Barburski, J., Bolek, M., Gostkowska-Drzewicka, M., Homa, M., MoKHcibrodzka, M., ... & Osiichuk, D. (2016). The Importance of Financial Ratios in Predicting Stock Price Trends: A Case Study in Emerging Markets.T Finanse. Rynki Finansowe. Ubezpieczenia, (1 (79) Rynek kapitaKHowy i zarzFdzanie wartoKHciF), 13-26.
Bhattacharyya, H. (2007).T Total management by ratios: An analytic approach to management control and stock market valuations. New Delhi: Sage Publications
Duchin, R., & Sosyura, D. (2014). Safer ratios, riskier portfolios: BankszG response to government aid.T Journal of Financial Economics,T 113(1), 1-28.
Films for the Humanities & Sciences (Firm), Films Media Group., & Agency for Instructional Technology. (2008).T Ratios. New York, N.Y: Films Media Group.T
Films on Demand., & Films Media Group. (1995).T Ratios. Lawrenceville, NJ: Films Media Group.
MorningStar. Accessible on 4 March 2017. Available at http://financials.morningstar.com/cash-flow/cf.html?t=HHC®ion=usa&culture=en-US
ReadyRatios. Accessible on 4 March 2017. Available at https://www.readyratios.com/reference/profitability/
Cite this page
Finance Essay Sample on Howard Hughes Corporation. (2018, Apr 24). Retrieved from https://speedypaper.net/essays/101-howard-hughes-corporation
Request Removal
If you are the original author of this essay and no longer wish to have it published on the SpeedyPaper website, please click below to request its removal:
- Education Essay Sample: Teaching Vocabulary with Music
- Economics Paper Sample: Answer Questions
- Esay Sample on the Decline of Religion Due to Advancements in Science and Philosophy
- Need AACN Essentials essays? - Read an Essay Sample on AACN Essentials
- Business Essay Sample on Social Media Services
- Free Essay Analyzing Digital Platforms: Slack, Trello, And GoToMeeting
- Critical Essay on "Becoming": A Memoir by Mitchell Obama
Popular categories


