| Type of paper: | Essay |
| Categories: | Education Students Analysis |
| Pages: | 6 |
| Wordcount: | 1603 words |
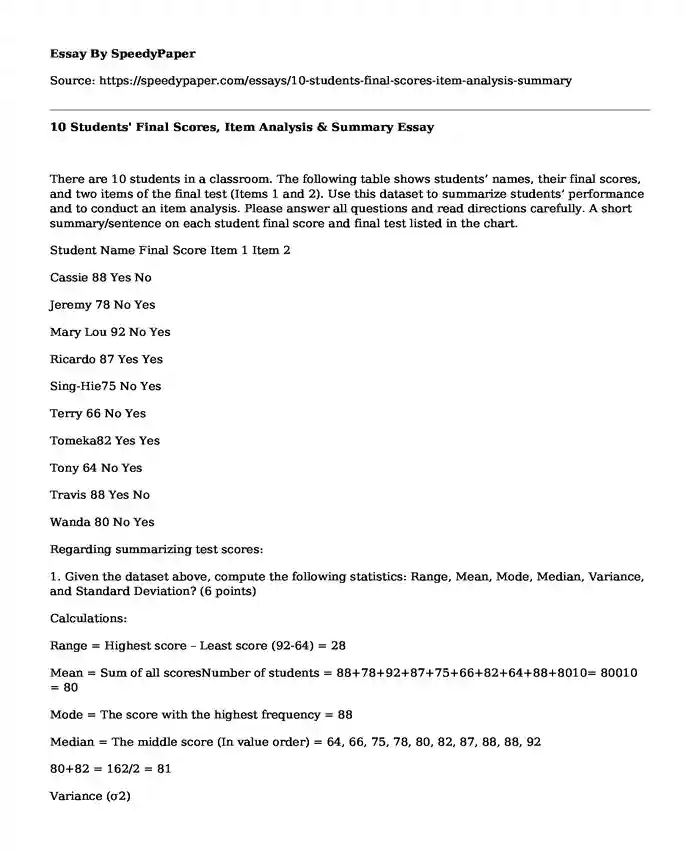
There are 10 students in a classroom. The following table shows students' names, their final scores, and two items of the final test (Items 1 and 2). Use this dataset to summarize students' performance and to conduct an item analysis. Please answer all questions and read directions carefully. A short summary/sentence on each student final score and final test listed in the chart.

Student Name Final Score Item 1 Item 2
Cassie 88 Yes No
Jeremy 78 No Yes
Mary Lou 92 No Yes
Ricardo 87 Yes Yes
Sing-Hie75 No Yes
Terry 66 No Yes
Tomeka82 Yes Yes
Tony 64 No Yes
Travis 88 Yes No
Wanda 80 No Yes
Regarding summarizing test scores:
1. Given the dataset above, compute the following statistics: Range, Mean, Mode, Median, Variance, and Standard Deviation? (6 points)
Calculations:
Range = Highest score - Least score (92-64) = 28
Mean = Sum of all scoresNumber of students = 88+78+92+87+75+66+82+64+88+8010= 80010 = 80
Mode = The score with the highest frequency = 88
Median = The middle score (In value order) = 64, 66, 75, 78, 80, 82, 87, 88, 88, 92
80+82 = 162/2 = 81
Variance (s2)
Score (x) Mean (x ) x- x (x- x)2= s2
88 28 60 3600
78 28 50 2500
92 28 64 4096
87 28 59 3481
75 28 47 2209
66 28 38 1444
82 28 54 2916
64 28 36 1296
88 28 60 3600
80 28 54 2916
S 800 28058
Variance (s2) = (x- x)2N-1 = 2805810-1= 3117.56
Standard Deviation = variance = 3117.56 = 55.84
2. Decide whether the shape of the distribution is symmetrical, positively skewed, or negatively skewed (explain how your decision is made and provide statistical evidence, such as mean, median, and mode) and use the shape of distribution to describe how students perform on their final exam. (2 points)
The shape of distribution is negatively skewed. When data is negatively skewed or skewed on the left, the mean is smaller the median. The mean is 80 while the median is 81.
Regarding conducting item analysis:
3. Given the dataset above, compute the difficulty (p) and discrimination index (D) for Items 1 and 2 (Construct a table for high and low performing groups and show all your computational processes in details). (6 points)
Student Name Final Score Item 1 Item 2
Cassie 88 Yes No
Jeremy 78 No Yes
Mary Lou 92 No Yes
Ricardo 87 Yes Yes
Sing-Hie75 No Yes
Terry 66 No Yes
Tomeka82 Yes Yes
Tony 64 No Yes
Travis 88 Yes No
Wanda 80 No Yes
Difficulty Difficulty =Number of correct responses/Number of respondents
Item1: 4 10 = 0.4
Item 2: 8 10 = 0.8
Discrimination index = (Number of students who got correct the item right in upper group - Number of students who got correct the item right in lower group)
Discrimination index = Correct Upper group-Correct Lower groupNumber in the groupItem 1: 4-610 = -0.2
Item 2: 8-210 = 0.6
Item #Correct
(Upper Group) #Correct
(Lower Group) Difficulty (p) Discrimination (D)
1 4 6 0.4 -0.2
2 8 2 0.8 0.6
4. Provide a short explanation about what these results are telling you regarding items 1 and 2 (i.e., use these statistical item properties, such as item difficulty and discrimination, to explain the quality of Items 1 and 2). (4 points)
For item 1, the difficulty index was 0.4 and this means that the item was quite difficult and at the same time, it had a negative discrimination index of -0.2. The negative discrimination implies that the low performing students had high likelihood of getting the item correct while the high performing students were not likely to get the item correct. Item 1 should be analyzed carefully. On the other hand, there is item with the difficult index of 0.8 and a positive discrimination index of 0.6. In this case, the high performing students had high likelihood of getting item 2 correct. In a ratio of 0-1, it implies that Item 2 was more difficult than item 1and thus item 2 was very easy and thus majority of the students got the correct answer.
-63817528930600.13%
000.13%
190500281432000497205028143200042519602266315Approximately 2% of the scores are higher than two standard deviations above the mean
00Approximately 2% of the scores are higher than two standard deviations above the mean
-1905003105150005236845319087500523684529051250.13%
000.13%
-10585452266315Approximately 2% of the scores are lower than two standard deviations below the mean
4000020000Approximately 2% of the scores are lower than two standard deviations below the mean
Z-score formula:
Z = (X -M)/SD
For example, a student score on the GRE quantitative exam (X) minus the mean on the GRE quantitative (M). Divide that difference by the standard deviation (SD)
(see pages 273-276 in your book, 11th edition)
T-score formula:
T = 10z + 50
Multiply the z-score (z) by 10 and add 50 to this value to obtain the equivalent T-score (T).
(see page 277 in your book, 11th edition)
Question 2: (26 points)
The National Center for Educational Statistics report that in the year ending 2009, 400,000 students took the Graduate Record Examination (GRE). For this set of examinees, the observed mean Verbal score was 560 with a standard deviation (SD) of 90, and the observed mean Quantitative score was 490 with a standard deviation (SD) of 100.
Assuming that the distribution of scores on the 2009 GRE was normal, answer the following questions regarding both tests (Verbal and Quantitative): (Show all your computations and use statistical evidence to interpret your answer). Number your responses and circle your final answers.
(1 point for each item from 1-4)
Note: please notice that one of these questions ask for a percent and the others ask for the number of students. Respond appropriately.
What percent of student scores were below the mean?
Percentage rank of scores below mean (x) = 49.99%
How many student scores were above the mean?
Percent of students above mean = 49.99%
How many student scores fall between 1 SD below the mean (-1SD) and 1 SD above the mean (+1SD).
(-1SD) = 13.59% *400,000 = 54,360 scores
(+1SD) = 13.59% *400,000 = 54,360 scores
How many students' scores were higher than 2 SD above the mean?
(+1SD) = 2.14%*400,000 = 8,560 scores
(2 point for each item from 5-14)
Ann has a score of 380 on the Verbal exam. What is her z-score?
Z = (X -M)/SD = 380-56090 = -2
The z-score of -2 implies that Ann's score of 380 on the verbal exam was -2 Standard Deviations below the mean (mean is 90).
What is Ann's percentile rank?
Ann's percentile rank = 2%*400,000 = 8,000
Ann was position number = 8,000 out of the total number of the students who sat for the test.
How was Ann performing relative to her peers?
7999 students scored higher marks than Ann and 391,999 scored lower marks and were ranked after her.
What is the z-score of Sam who scores 760 on the Quantitative exam?
Z = (X -M)/SD = 760-490100 = +2.7
What is Sam's percentile rank?
98%*400,000 = 392,000
The reason is that z-score of +2.7 is above +2s and below +3s.
How was Sam performing relative to his peers?
391,999 students scored higher marks than Ann and 7,999 scored lower marks and were ranked after him.
Betty's score on the Verbal exam is 1 SD above the mean. What is her score?
Z = (X -M)/SD = x-56090 = +1; Then, x -560 = 90; x=650
Betty's score = 650
John scores 500 on the Verbal exam. What is his z-score?
Z = (X -M)/SD = 500-56090 = -0.7
Convert John's score above to a T-score.
T-score = 10z+50 = -0.7x10+50 = 43
If Nicole had a Quantitative score of +1.5 SD's what was her raw (numerical) score?
Z = (X -M)/SD = x-490100 = +1.5 = x -490 = 150;
Numerical score (x) = 490+150 = 640
15. If a student had to score at or above the 84th percentile for both tests to be considered for a full scholarship at USF, what would be the minimum score needed on Verbal and Quantitative exams?
Verbal exam
If 90% = 560 score
Therefore; 84% =?
=84%x56090% = 522.67
Minimum score would be = 523
Quantitative exams
If 100% = 490 score
Therefore, 84% =?
=84%x490100% = 411.6
Minimum score would be = 412
Question 3: (6 points)
You have a student, Tej, entering your school from India. You need to know which math class you should place him in. The scores you normally use are SAT scores (mean=500 and standard deviation=100). The rules you use for placement are: 700-800 Calculus 500-699 Trigonometry 300-499 Geometry 100-299 Algebra However, this student did not take the SAT, but instead took the AAT (Academic Aptitude and Achievement Test). Scores for the AAT are reported with a mean of 80 and a standard deviation of 4. Tej received a raw score of 92 on the math portion of the AAT. Convert his scores to a metric so that they are comparable to SAT scores, then decide in which math class Tej should be placed. (Hint: you could begin by converting his AAT to a z-score).Tej's z-score = Z = (X -M)/SD = 92-804 = +3;
+3s = 99.9 percentile' 99.9%*500 = 499.5
On SAT score test= Z = (X -M)/SD = x-500100 = +3; x-500 =300
Therefore, x=800
Therefore, his numerical score was 800
Your answer should include at least 2 paragraphs:
Explain (using words and numbers) which course Tej should be placed in, and why. Make sure to include a thorough explanation. (5 points)
Taj's standard deviation was +3 under the AAT score and after conversion to SAT score, his numerical score is calculated to be 800. The score of 800 falls with the range of 700-800 for the calculus class.
As a result, Taj's score enables him to study calculus. The +3s means that he has got three standard deviations above the mean required for admission into the class. Therefore, he is above the average.
+3s is equivalent to 99.9 percentile and this falls under 700-800. Therefore, Tej should be placed in the calculus class.
Find and provide some background information on the AAT and include an explanation of why this might be an appropriate score to use for this purpose. Include the reference you used for information on the AAT. (1 point)
The Academic Aptitude and Achievement Test (AAT) is a test largely used in India for testing cognitive ability of students seeking admission into different classes. The primary object of AAT is to enable teachers to know as quickly as possible the abilities of students and their educational accomplishments. Knowing the academic abilities of the students helps the teachers to offer the best guidance for admission.
It is also important to note that AAT tests important aspects such as the discrimination between the higher and lower scores in classes. Its goal is also to enhance understanding of the correlations between verbal and quantitative scores for different subjects. Finally, AAT does not have any gender bias. According to Finn, Kraft, West, Leonard, Bish, Martin & Gabrieli (2014), achievement tests such as AAT increase the cognitive skills of students. Therefore, ATT's score is appropriate in this case because it will improve cognitive ability of students.
Reference
Finn, A. S., Kraft, M. A., West, M. R., Leonard, J. A., Bish, C. E., Martin, R. E., ... & Gabrieli, J. D. (2014). Cognitive skills, student achievement tests, and schools. Psychological Science, 25(3), 736-744.
Cite this page
10 Students' Final Scores, Item Analysis & Summary. (2022, Dec 28). Retrieved from https://speedypaper.net/essays/10-students-final-scores-item-analysis-summary
Request Removal
If you are the original author of this essay and no longer wish to have it published on the SpeedyPaper website, please click below to request its removal:
- Free Essay on Ben Franklin, Powerpoint Ppresentation Text
- Free Essay on the Male and Female Reproductive Systems
- Essay Sample about Mountains Beyond Mountains
- Substance Dependence and Abuse, Free Essay for Everyone
- Terrorists Behavioral Analysis, Essay Sample
- The Child Witness
- Essay Example: Improving Pronunciation of the Letter (P) Among Saudi English Learners
Popular categories


