| Type of paper: | Essay |
| Categories: | Culture Research Statistics |
| Pages: | 5 |
| Wordcount: | 1203 words |
Descriptive statistics in terms of frequency
In this research project a total of 25 participants completed the questionnaire. They included 12 males and 13 females. After the completion of the questionnaire which had four sections, an analysis is conducted so as to develop results from the survey data. Descriptive statistics in terms of frequency was undertaken which highlighted the percentages, sum, mean, median, minimum and maximum of the variables in question. They were used to show variance and standard deviation followed the sequence. The criterion that directly related to the research question was identified. Regression and correlation analysis were conducted to investigate the relationship between the independent and dependent variables. In Bivariate analysis, the contingency tables were used to relate at least two dependent variables. The ANOVA and ANCOVA tables are presented to assess variance and covariance of the set of variables thus investigating the relationship and the strength of association between the variables.

The major dependent variables in the research included:
• How often is the interaction with the Arab origin
• Ever visited or lived in Arab world
• Familiarization to some Arabic words before enrollment
• Relationship with the Arab origin
• Awareness of the uniqueness of cultural ideas and practices before enrollment
• Perception of Arab culture
• Arab heritage
The independent variables in the research were:
• Gender
• Age
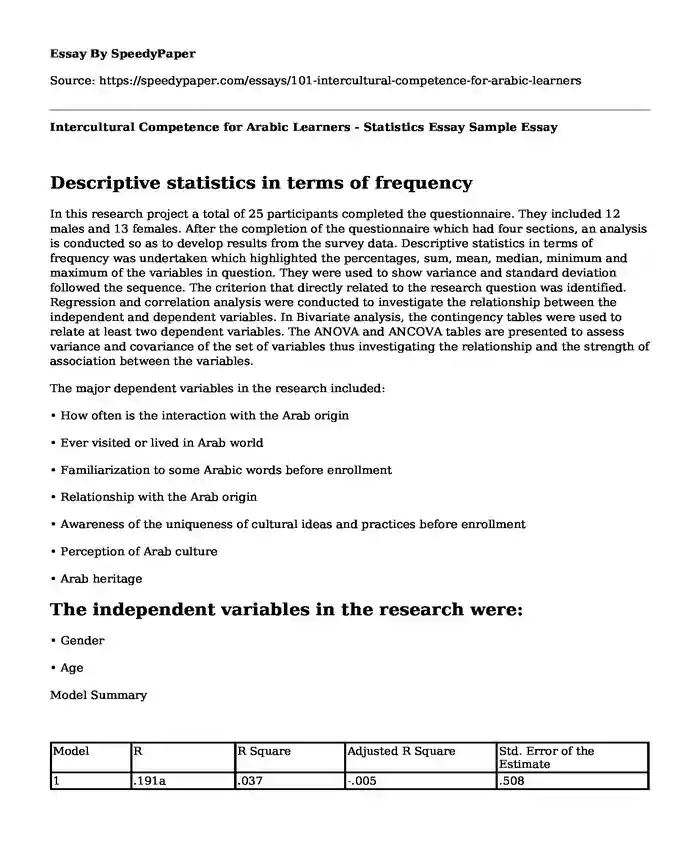
Model Summary
| Model | R | R Square | Adjusted R Square | Std. Error of the Estimate |
| 1 | .191a | .037 | -.005 | .508 |
Predictors: (Constant), Arabian Relationship
The regression analysis to assess the relationship between gender and Arabian relationship displays that the two variables are not related. The R value of 0.191 is much lower thus very weak correlation. R squared clearly indicates that the dependent.
Variable (Arabian relationship) could only explain 3.7% of the independent variable.
https://imgur.com/a/dRGKPkS
There was an existing relationship between the age group and whether the participant had visited or lived in Arab world. All the participants of age 16 – 18 years had visited or lived in the Arab world while those of age 22 – 25 years and over 25 years recording the same figure. Majority of those aged 19 – 21 years had not visited or lived in the Arab world. Those 22 – 25 years recorded the highest figure of those that had neither visited nor lived in the Arab world. This finding demonstrates that age is a factor in determining those that had visited or lived in Arab world thus the relationship.
Perception of the Arab culture
There was a relationship between age and the perception of the Arab culture. The age group affected the perception of the culture. None of those aged 19 – 21 years had a positive perception of the Arab culture while those that were positive and over 25 years were more than those that had a neutral perception. Those that were neutral aged between 22 – 25 years were many than those that had positive and negative perception. None of those 16 – 18 years had a neutral perception. They recorded the highest figure of those that had a negative perception though some had a positive perception. The perception of Arab culture was different in various age groups with conclusion that the younger the participant having a negative perception.
The cross tabulation between gender, those who ever visited or lived in the Arab world is interpreted that gender is a determining factor. Overall, those who had visited or lived in the Arab world 33.3 % had a positive perception, 53.3% had a negative perception while 13.3% had a neutral perception. Out of those that had not visited or lived in Arab world, 24 % had a positive perception, 36% had negative perception and 40% were neutral of the Arab culture.
Gender * PerceptionOfArabCulture * VisitedOrLivedInArab Crosstabulation
| VisitedOrLivedInArab | PerceptionOfArabCulture | Total | |||||
| Positive | Negative | Neutral | |||||
| Yes | Gender | Male | Count | 2 | 3 | 2 | 7 |
| % within Gender | 28.6% | 42.9% | 28.6% | 100.0% | |||
| % within PerceptionOfArabCulture | 40.0% | 37.5% | 100.0% | 46.7% | |||
| Female | Count | 3 | 5 | 0 | 8 | ||
| % within Gender | 37.5% | 62.5% | 0.0% | 100.0% | |||
| % within PerceptionOfArabCulture | 60.0% | 62.5% | 0.0% | 53.3% | |||
| Total | Count | 5 | 8 | 2 | 15 | ||
| % within Gender | 33.3% | 53.3% | 13.3% | 100.0% | |||
| % within PerceptionOfArabCulture | 100.0% | 100.0% | 100.0% | 100.0% | |||
| No | Gender | Male | Count | 1 | 0 | 6 | 7 |
| % within Gender | 14.3% | 0.0% | 85.7% | 100.0% | |||
| % within PerceptionOfArabCulture | 100.0% | 0.0% | 75.0% | 70.0% | |||
| Female | Count | 0 | 1 | 2 | 3 | ||
| % within Gender | 0.0% | 33.3% | 66.7% | 100.0% | |||
| % within PerceptionOfArabCulture | 0.0% | 100.0% | 25.0% | 30.0% | |||
| Total | Count | 1 | 1 | 8 | 10 | ||
| % within Gender | 10.0% | 10.0% | 80.0% | 100.0% | |||
| % within PerceptionOfArabCulture | 100.0% | 100.0% | 100.0% | 100.0% | |||
| Total | Gender | Male | Count | 3 | 3 | 8 | 14 |
| % within Gender | 21.4% | 21.4% | 57.1% | 100.0% | |||
| % within PerceptionOfArabCulture | 50.0% | 33.3% | 80.0% | 56.0% | |||
| Female | Count | 3 | 6 | 2 | 11 | ||
| % within Gender | 27.3% | 54.5% | 18.2% | 100.0% | |||
| % within PerceptionOfArabCulture | 50.0% | 66.7% | 20.0% | 44.0% | |||
| Total | Count | 6 | 9 | 10 | 25 | ||
| % within Gender | 24.0% | 36.0% | 40.0% | 100.0% | |||
| % within PerceptionOfArabCulture | 100.0% | 100.0% | 100.0% | 100.0% | |||
https://imgur.com/a/B982VVd
None of the female participants had a neutral perception. They were either positive or negative on the Arab culture. Studies such as those by Sumi & Sumi, (2015) reported the same case. Many females had both positive and negative perception more than their men counterparts.
The ANOVA table
The ANOVA table shows that there is a significant statistical difference between how often the participant interacted with the people of Arab origin and whether they knew Arabic. However, the significant value 0.629 in the table explains that having interacted with the Arab origin; a participant had a 62.9% possibility of having known the Arabic. The F value of 0.656 which is >0.05 leads to the rejection of the null hypothesis.
ANOVA
Interaction Level
| Sum of Squares | df | Mean Square | F | Sig. | |
| Between Groups | 3.973 | 4 | .993 | .656 | .629 |
| Within Groups | 30.267 | 20 | 1.513 | ||
| Total | 34.240 | 24 | |||
https://imgur.com/a/cJckqDJ
Dependent Variable: Arabian Relationships
Method: ANCOVA (Type I Sum of Squares)
The Covariates appearing in the model are evaluated at the following values. Interaction level= 3.48
The specific statistical technique used to assess the relationship and the strength of association is the Regression analysis.
Multivariate analysis of variance
Multivariate analysis of variance (MANOVA) is an extension of analysis of variance for use when you have more than one dependent variable (Bernstein, 2012). Since in the data there is more than one dependent variable that is related in some way, MANOVA could be conducted. Depending on the nature of the research question, the variables to include would be the perception of Arab culture, visit or lived in the Arab world, relationship with the Arab origin and how often the participant interacts with the people of Arab origin.
The use of Multivariate analysis of variance (MANOVA) is that it gives one the opportunity to compare different data sets based on groups and tell whether their means differ significantly (Chatfied & Collins, 2013). It helps one to know whether the difference in means between groups occurred by chance or not. In addition, MANOVA gives one the chance to analyze variances using combined variables that are dependent on each other just like in the case of this study.
Based on the merits accrued when using Multivariate analysis, it was prudent to use it for this research because of the manner in which it helped in providing information about the significant difference between groups for the composite dependent variables. It also helped to provide univariate result for each dependent variable.
References
Bernstein, I. H. (2012). Applied multivariate analysis. Springer Science & Business Media.
Chatfied, C., & Collins, A. J. (2013). Introduction to multivariate analysis. Springer.
Holmes, P., & O’Neill, G. (2012). Developing and evaluating intercultural competence: Ethnographies of intercultural encounters. International Journal of Intercultural Relations, 36(5), 707-718.
Rehman, M. S. (2014). Developing intercultural communicative competence in the Arabic curriculum: a survey of learners at beginner level (Doctoral dissertation).
Sumi, K., & Sumi, A. M. (2015). Development of the Interest in Arabic Culture Scale (IACS): A Measure of Interest in Arabic Culture for Students Learning Arabic in Japanese Universities. Journal of Psychology & Psychotherapy, 5(3), 1.
Cite this page
Intercultural Competence for Arabic Learners - Statistics Essay Sample. (2018, Aug 06). Retrieved from https://speedypaper.net/essays/101-intercultural-competence-for-arabic-learners
Request Removal
If you are the original author of this essay and no longer wish to have it published on the SpeedyPaper website, please click below to request its removal:
- Memento Character Analysis and Comparison, Free Essay on the Movie
- Damage Assessment Essay Sample
- Essay Example on Just and Unjust Laws by Martin Luther King
- Essay Example on Liberal Arts Education
- Investment Essay Sample: Risk and Returns Analysis
- Free Essay with the Family and Personal History
- Genre Reflective Essay
Popular categories


