An income statement reflects four various types of profits and the corresponding profit margins namely; gross, operating, pre-tax, and net profits. An analysis of profit margins outlines the absolute volume for a given level of profitability and the actual profit as a numerical percentage of the total cost of sales and revenue generated. The analysis result obtained can be used to comprehensively gauge the companys profitability over a specified span of years, for instance from 2014 to 2016 as in the case of Hai-O Enterprise in the table below.

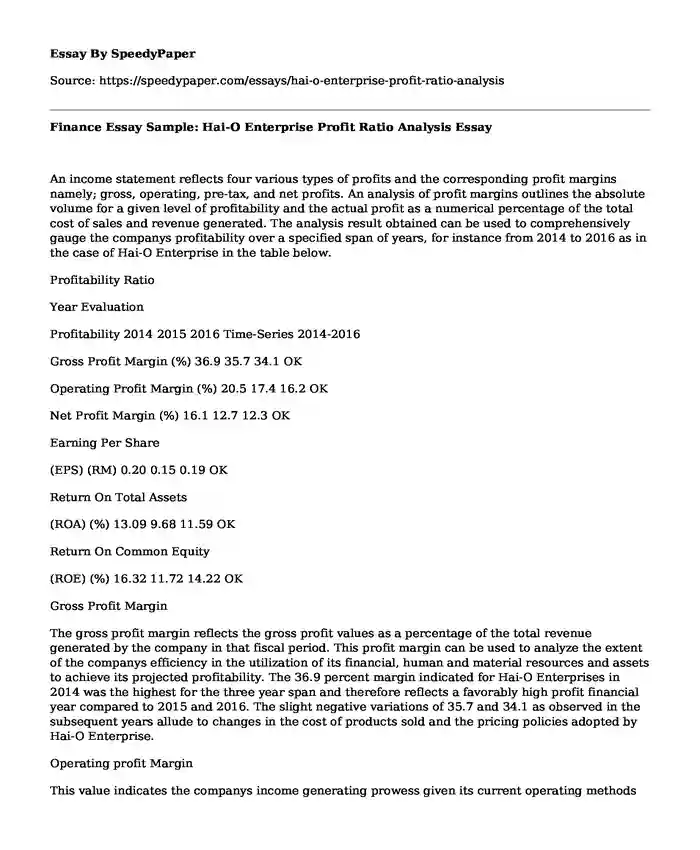
Profitability Ratio
Year Evaluation
Profitability 2014 2015 2016 Time-Series 2014-2016
Gross Profit Margin (%) 36.9 35.7 34.1 OK
Operating Profit Margin (%) 20.5 17.4 16.2 OK
Net Profit Margin (%) 16.1 12.7 12.3 OK
Earning Per Share
(EPS) (RM) 0.20 0.15 0.19 OK
Return On Total Assets
(ROA) (%) 13.09 9.68 11.59 OK
Return On Common Equity
(ROE) (%) 16.32 11.72 14.22 OK
Gross Profit Margin
The gross profit margin reflects the gross profit values as a percentage of the total revenue generated by the company in that fiscal period. This profit margin can be used to analyze the extent of the companys efficiency in the utilization of its financial, human and material resources and assets to achieve its projected profitability. The 36.9 percent margin indicated for Hai-O Enterprises in 2014 was the highest for the three year span and therefore reflects a favorably high profit financial year compared to 2015 and 2016. The slight negative variations of 35.7 and 34.1 as observed in the subsequent years allude to changes in the cost of products sold and the pricing policies adopted by Hai-O Enterprise.
Operating profit Margin
This value indicates the companys income generating prowess given its current operating methods and mechanisms. This can be translated into the base of cash flow within the organization and directly gauges the growth of the enterprise. With a record 20.5 percent in 2014 and negative deviations to 17.4 and 16.2 percent in the subsequent years, it is evident that there is unhealthy business growth within Hai-O Enterprises. The variations indicate possibilities of deficiencies in management and operational skills that translate to negative turnover of sales into pre-tax profits.
Net profit Margin
The net profit margin is the net profit obtained expressed as a percentage of the total sales made by the enterprise. This is a major profitability indicator that is of much importance to investors and the enterprise owners. The business registered their highest net profit margin (16.1 percent) in 2014 with a subsequent decline in the following years to 12.7 and 12.3 percent.
Earnings per Share
This reflects the profitability in terms of gains on the company shares and a higher value indicates that the company has more gains at its exposure to give to spread to its stakeholders. Higher values of the earnings per share also increase a companys stock value. The company has been gaining its earnings on this front with values of 0.2, 0.15 and 0.19 percent for the respective years.
Return on Total Assets and Return on Common Equity
Return on total assets and return on common equity margins indicate the profitability of the companys assets and stockholders equity respectively. The enterprise registered mixed deviations over the years with highest values being 13.09 and 16.32 percent, respectively, for the year 2014. These values can be used to determine the enterprises growth from within and growth sustainability. Variations in these values are attributed to the changes in asset management and stock value.
References
Relationships between ROA, ROE, and Growth. (2016). Boundless. Retrieved from https://www.boundless.com/finance/textbooks/boundless-finance-textbook/analyzing-financial-statements-3/the-dupont-equation-roe-roa-and-growth-44/relationships-between-roa-roe-and-growth-224-38
Earnings Per Share | Formula | Analysis | Example. (2016). My Accounting Course. Retrieved 25 September 2016, from http://www.myaccountingcourse.com/financial-ratios/earnings-per-share
How to Analyze Profitability - Edward Lowe Foundation. (2000). Edward Lowe Foundation. Retrieved 25 September 2016, from http://edwardlowe.org/how-to-analyze-profitability-2/
Profitability Indicator Ratios: Profit Margin Analysis | Investopedia. (2007). Investopedia. Retrieved 25 September 2016, from http://www.investopedia.com/university/ratios/profitability-indicator/ratio1.asp
Cite this page
Finance Essay Sample: Hai-O Enterprise Profit Ratio Analysis. (2019, Nov 07). Retrieved from https://speedypaper.net/essays/hai-o-enterprise-profit-ratio-analysis
Request Removal
If you are the original author of this essay and no longer wish to have it published on the SpeedyPaper website, please click below to request its removal:
- World Hunger Essay Sample for Free Download
- Conflicts in Organizations and Impact on Organizational Culture - Free Essay in Management
- Learn More about Preschoolers and Nutrition in Our Essay
- Business Essay Example: Nvidia's Case Study
- Free Essay: Effects of Civil War on American Literature
- Free Essay. the Construction Industry and Its Environmental Impact on Water Quality
- Essay Example. Midterm Artifacts Reflection
Popular categories


